-
Depreciation: what the car is worth less each year. You don't pay it monthly, but you lose it when you sell. Source
-
Gas for the miles you drive. Source
-
Full coverage. Source
-
Oil, brakes, fluids, repairs. Rises as the car ages. Source
-
Only the interest. The loan principal is the car itself, already counted in "Loses value". Source
-
Sales tax, title, registration, property or excise tax, inspection, EV fee. Source
-
A new set every N miles, spread over the miles you drive. Source
-
Parking and tolls. Only what you enter.
See the year by year numbers
| Year | Loses value | Gas | Insurance | Maintenance & repairs | Tires | Loan interest | Taxes & fees | Parking & tolls | Total | Car is worth |
|---|---|---|---|---|---|---|---|---|---|---|
| 1 | $6,900 | $2,201 | $2,293 | $1,294 | $208 | $1,895 | $2,738 | $0 | $17,529 | $27,600 |
| 2 | $3,613 | $2,201 | $2,187 | $1,294 | $208 | $1,521 | $262 | $0 | $11,286 | $23,987 |
| 3 | $3,140 | $2,201 | $2,125 | $1,294 | $208 | $1,124 | $240 | $0 | $10,333 | $20,847 |
| 4 | $2,729 | $2,201 | $2,068 | $1,432 | $208 | $702 | $221 | $0 | $9,562 | $18,119 |
| 5 | $2,372 | $2,201 | $2,015 | $1,602 | $208 | $254 | $204 | $0 | $8,856 | $15,747 |
The first car I bought on my own was a five-year-old sedan with a payment I could afford. What I hadn’t budgeted for was everything else. Insurance went up when I moved to a new state. The registration renewal cost more than I expected. At 60,000 miles it needed tires, brakes and a timing belt in the same year. When I sold it, it was worth less than half of what I paid. The payment was the smallest part of what that car cost me.
This cost of owning a car calculator adds up all of it. Pick your car and your state and it fills in real numbers: EPA fuel economy for 4,805 models sold since 2012, gas and electricity prices for your state, your state’s taxes and registration fees, insurance and the value your car will lose. You can change any number. You can keep the car from 1 to 15 years and drive any number of miles, and you can compare up to three cars side by side.
How much does it cost to own a car?
AAA puts the average cost of owning a new car in 2026 at $12,863 a year. That is $1,072 a month, $35 a day and about 86 cents a mile, for a new car driven 15,000 miles a year and kept for five years. Here is where that money goes.
| Cost | Per year | Per month |
|---|---|---|
| Depreciation (value the car loses) | $4,422 | $369 |
| Fuel (17.32 cents a mile) | $2,598 | $217 |
| Insurance | $2,098 | $175 |
| Maintenance, repairs and tires (11.73 cents a mile) | $1,760 | $147 |
| Loan interest | $1,184 | $99 |
| License, registration and taxes | $802 | $67 |
| Total | $12,863 | $1,072 |
Your number will be different. A small sedan in a cheap-insurance state can cost half of that. A full-size pickup in California can cost much more. The calculator above starts from these averages and then adjusts every line for your car, your state and the way you drive.
What counts as a car cost
The calculator splits the cost of owning a car into seven parts. Six of them are money you pay. One of them is money you lose.
- Loses value. Depreciation is the drop in what your car is worth. You never get a bill for it, but you feel it on the day you sell or trade in.
- Gas or charging. Miles driven divided by fuel economy, times what you pay for gas or electricity.
- Insurance. Full coverage for an adult driver with a clean record. It drops a little each year as the car is worth less.
- Maintenance and repairs. Oil changes, brakes, fluids, filters and repairs. This cost rises every year as the car gets older.
- Tires. A new set every 40,000 to 60,000 miles, spread over the miles you drive.
- Loan interest. Only the interest. The price of the car is already counted in what it loses in value.
- Taxes and fees. Sales tax and title when you buy, then registration every year. Some states also charge a yearly property tax on cars, and most charge an extra fee for electric cars.
There is an eighth line for parking and tolls. It starts at zero because it depends entirely on where you live. If you pay for a garage or a toll road, add it.
Depreciation is the biggest cost of owning a car
Depreciation is a third of the total for most new cars. The average new car loses about 20% of its value in the first year. After five years the average car has lost 41.8% of its value, according to iSeeCars’ 2026 study of 950,000 used cars.
How much a car loses depends mostly on what kind of car it is:
- Pickup trucks lose the least, about 34% in five years.
- Hybrids lose about 35%.
- SUVs lose about 45%. Large SUVs lose more than 52%.
- Electric cars lose the most, about 57% in five years.
The calculator uses those figures by car type, then adjusts for the brand and for how many miles you drive. It also asks how you plan to sell. A trade-in gets you less than selling the car yourself, so the depreciation is higher. With the same car and the same miles, selling privately cuts the value loss by $2,184 over five years in the calculator’s default example.
Car maintenance cost by age and brand
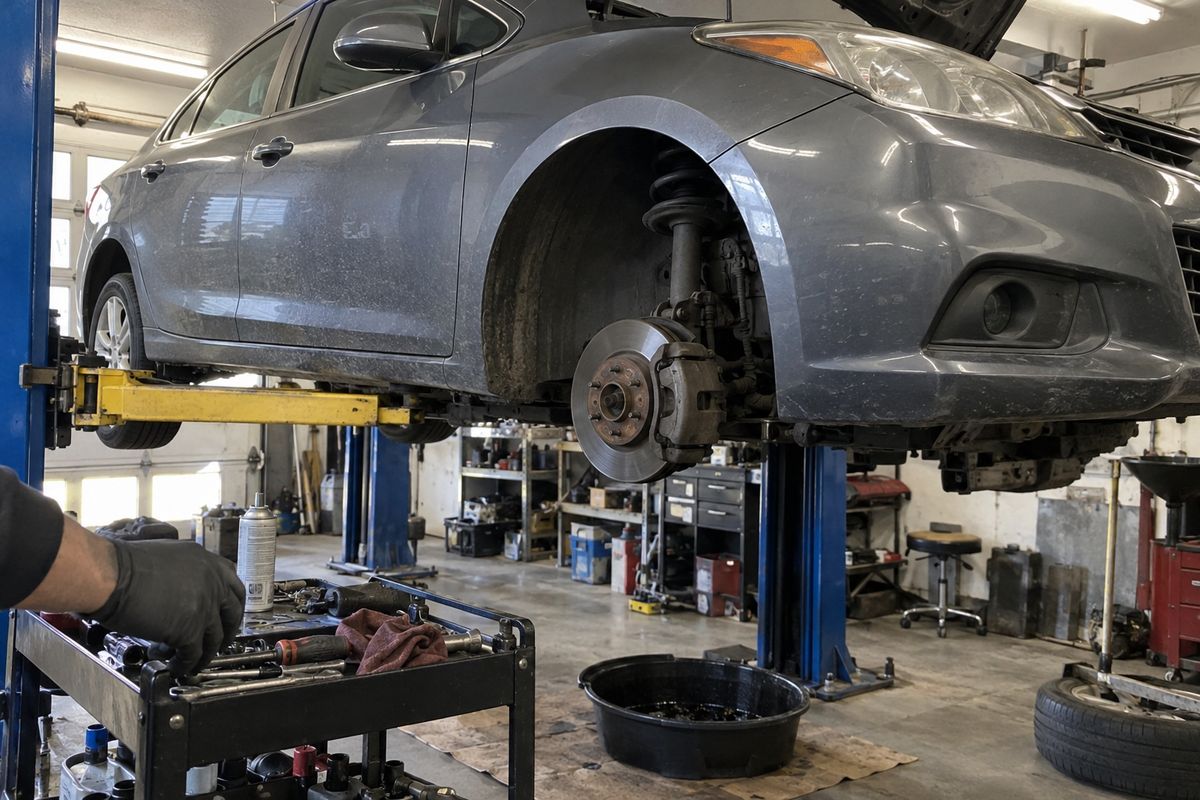
AAA’s 2026 figure for maintenance, repairs and tires is 11.73 cents a mile, or about $1,760 a year at 15,000 miles. That is an average over the first five years. A new car costs much less than that to keep up. An older car costs more.
Maintenance cost climbs with age. CarEdge’s 10-year data for Toyota shows about $253 in the first year and about $795 in the tenth. The calculator uses that shape. Years one to three stay low because the warranty pays for most repairs. From year four the cost rises each year and levels off after year ten.
The brand matters too. RepairPal’s average yearly repair cost across all brands is $652. These are the brands at each end (for the long view, see our list of the most reliable car brands):
| Brand | Average repair cost per year |
|---|---|
| Honda | $428 |
| Toyota | $441 |
| Mazda | $462 |
| Hyundai | $468 |
| Kia | $474 |
| All brands average | $652 |
| BMW | $968 |
| Audi | $987 |
| Jaguar | $1,123 |
| Land Rover | $1,174 |
| Porsche | $1,192 |
Electric cars cost less to maintain. There is no oil, no spark plugs, no transmission fluid and brake pads last longer because regenerative braking does most of the work. Argonne National Laboratory puts scheduled maintenance at 6.1 cents a mile for an electric car against 10.1 cents for a gas car, which is 40% less. EVs do wear out tires faster because they are heavier, and the calculator accounts for that.
Gas vs hybrid vs electric: which is cheaper to own?

Hybrids are the cheapest to own. AAA’s 2026 study compared gas, hybrid and electric versions in four classes. The hybrid cost the least in all four. The electric car cost the most in three of them, because it loses value so fast that the fuel savings can’t make up the gap.
| Class | Gas | Hybrid | Electric |
|---|---|---|---|
| Medium sedan | $10,582 | $10,204 | $13,662 |
| Compact SUV | $11,656 | $11,201 | $11,888 |
| Medium SUV | $14,431 | $13,698 | $14,332 |
| Pickup | $16,626 | $16,117 | $17,414 |
Those are averages for a new car kept five years. Two things change the answer for an electric car. The first is where you charge. At home you pay your state’s electricity rate, which ranges from about 13 cents a kWh in Nevada to 47 cents in Hawaii. A public fast charger costs about 53 cents a kWh, which can make an EV more expensive to fuel than a hybrid. The second is how long you keep it. Most of an EV’s value loss happens early, so the longer you keep it, the better it compares. Use the compare button above to test a gas, hybrid and electric version of the same car with your own state and miles. Our guide to electric cars vs hybrid cars covers the differences beyond cost.
Total cost of ownership: new vs used
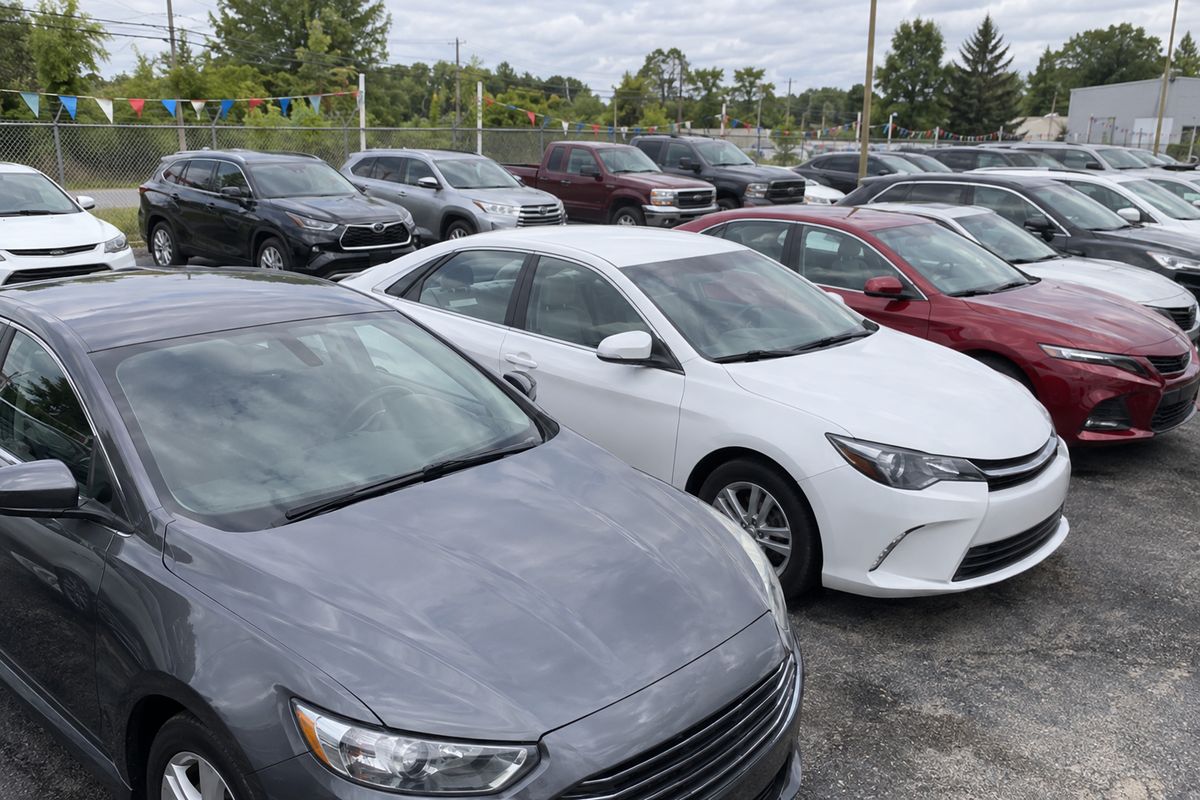
A used car is almost always cheaper to own because the first owner already took the biggest drop in value. In the calculator, a three-year-old small SUV costs about $10,246 a year to own for five years, against $11,513 for the same car bought new. The used car loses less value and costs less to insure and tax, but it costs more to maintain and the loan rate is higher. If you’re deciding how to pay, read financing vs paying cash for a car and leasing vs buying a car.
The same logic says to keep the car longer. Depreciation slows down every year while repairs climb, and for almost every car the falling depreciation wins: the longer you keep it, the lower your cost per year. The gains get small after about year 10. The keep-it-longer chart in the calculator shows this for your car. For most car types, the yearly cost gets within 5% of its lowest point somewhere between year 12 and year 14.
Cost of owning a car by state
The same car costs very different amounts to own depending on where you live. The table below uses one car for every state: a new small SUV at $34,500, financed for 60 months with 10% down, kept five years and driven 13,500 miles a year in every state. Insurance, gas prices, sales tax, registration and property tax change from state to state.
A small SUV costs the least to own in New Hampshire, at $10,378 a year, and the most in Nevada, at $13,504 a year. That is a gap of $3,126 a year.
| State | Per year | Per month | Insurance/yr | Gas/yr | Taxes & fees/yr |
|---|---|---|---|---|---|
| Alabama | $10,983 | $915 | $1,860 | $1,934 | $743 |
| Alaska | $10,626 | $885 | $1,753 | $2,391 | $120 |
| Arizona | $12,353 | $1,029 | $2,416 | $2,447 | $1,033 |
| Arkansas | $11,454 | $954 | $2,309 | $1,940 | $768 |
| California | $12,838 | $1,070 | $2,266 | $3,064 | $1,043 |
| Colorado | $12,263 | $1,022 | $2,801 | $2,066 | $945 |
| Connecticut | $12,819 | $1,068 | $3,143 | $2,232 | $1,011 |
| Delaware | $12,124 | $1,010 | $3,100 | $2,193 | $409 |
| District of Columbia | $11,590 | $966 | $2,501 | $2,199 | $481 |
| Florida | $12,239 | $1,020 | $3,207 | $2,055 | $535 |
| Georgia | $10,843 | $904 | $1,881 | $1,989 | $532 |
| Hawaii | $11,140 | $928 | $1,561 | $2,436 | $731 |
| Idaho | $10,638 | $886 | $1,518 | $2,204 | $486 |
| Illinois | $11,384 | $949 | $1,903 | $2,210 | $804 |
| Indiana | $11,142 | $929 | $1,710 | $2,143 | $847 |
| Iowa | $10,982 | $915 | $1,753 | $2,116 | $694 |
| Kansas | $12,448 | $1,037 | $2,309 | $2,083 | $1,596 |
| Kentucky | $11,423 | $952 | $2,138 | $2,094 | $762 |
| Louisiana | $12,488 | $1,041 | $3,356 | $1,912 | $741 |
| Maine | $10,843 | $904 | $1,325 | $2,259 | $834 |
| Maryland | $11,615 | $968 | $2,159 | $2,320 | $695 |
| Massachusetts | $11,396 | $950 | $1,860 | $2,210 | $891 |
| Michigan | $11,844 | $987 | $2,672 | $2,116 | $626 |
| Minnesota | $11,776 | $981 | $2,287 | $2,121 | $927 |
| Mississippi | $11,518 | $960 | $2,074 | $1,901 | $1,125 |
| Missouri | $12,015 | $1,001 | $2,266 | $2,099 | $1,192 |
| Montana | $11,095 | $925 | $2,159 | $2,210 | $364 |
| Nebraska | $11,496 | $958 | $1,988 | $2,116 | $951 |
| Nevada | $13,504 | $1,125 | $3,442 | $2,474 | $1,133 |
| New Hampshire | $10,378 | $865 | $1,368 | $2,215 | $432 |
| New Jersey | $11,842 | $987 | $2,565 | $2,298 | $541 |
| New Mexico | $10,831 | $903 | $2,181 | $1,896 | $349 |
| New York | $11,773 | $981 | $2,330 | $2,270 | $712 |
| North Carolina | $10,445 | $870 | $1,518 | $2,033 | $497 |
| North Dakota | $10,794 | $900 | $1,860 | $2,077 | $439 |
| Ohio | $10,606 | $884 | $1,518 | $2,077 | $566 |
| Oklahoma | $11,079 | $923 | $2,202 | $2,055 | $410 |
| Oregon | $11,133 | $928 | $2,052 | $2,568 | $141 |
| Pennsylvania | $11,352 | $946 | $2,031 | $2,386 | $500 |
| Rhode Island | $12,154 | $1,013 | $2,843 | $2,298 | $571 |
| South Carolina | $10,839 | $903 | $1,945 | $1,967 | $548 |
| South Dakota | $10,887 | $907 | $2,010 | $2,116 | $354 |
| Tennessee | $10,886 | $907 | $1,817 | $2,094 | $531 |
| Texas | $11,368 | $947 | $2,544 | $1,879 | $512 |
| Utah | $11,633 | $969 | $2,309 | $2,193 | $686 |
| Vermont | $10,540 | $878 | $1,325 | $2,270 | $513 |
| Virginia | $11,089 | $924 | $1,732 | $1,984 | $965 |
| Washington | $12,518 | $1,043 | $2,245 | $2,683 | $1,115 |
| West Virginia | $11,118 | $926 | $1,839 | $2,006 | $844 |
| Wisconsin | $10,812 | $901 | $1,732 | $2,121 | $525 |
| Wyoming | $10,710 | $892 | $1,347 | $2,160 | $780 |
Cost of owning a car by type
Bigger cars cost more to own in every category, which is one reason a sedan beats an SUV on cost: they cost more to buy, lose more dollars of value, burn more fuel and cost more to insure. This is AAA’s 2026 cost per year by class next to what the calculator gives for the same miles and years. The calculator uses what buyers actually paid for each type of car in October 2026, from Kelley Blue Book, which is higher than the sticker prices AAA uses. That is why its figures come out a little higher.
| Class | AAA 2026 per year | Calculator per year | Price used |
|---|---|---|---|
| Small sedan | $9,259 | $10,007 | $28,000 |
| Midsize sedan | $10,555 | $11,405 | $34,000 |
| Subcompact SUV | $10,752 | $11,450 | $31,500 |
| Compact SUV | $11,670 | $12,684 | $38,000 |
| Midsize SUV | $14,447 | $15,707 | $50,500 |
| Midsize pickup | $13,089 | $13,219 | $44,000 |
| Full-size pickup | $16,449 | $17,660 | $68,000 |
How this calculator works
Every default in the calculator comes from a public source, and you can see the source for each one by tapping the line.
- Fuel economy comes from the EPA’s fueleconomy.gov data for every car sold since 2012.
- Gas prices come from the U.S. Energy Information Administration’s weekly survey for November 2026, adjusted for each state’s gas tax where EIA only reports a regional price. Electricity prices are EIA’s residential rates by state.
- Insurance starts from AAA’s 2026 full-coverage average and is scaled by each state’s average from ValuePenguin’s 2026 rate study and by the type of car.
- Taxes and fees come from each state’s DMV and revenue department: sales tax on vehicles, title fees, registration, property or excise tax, inspections and EV fees.
- Depreciation uses iSeeCars’ 2026 five-year figures by car type and CarEdge’s value curves by brand.
- Maintenance uses AAA’s cost per mile, CarEdge’s cost by age and RepairPal’s averages by brand.
- Loan rates are Experian’s averages by credit score for the second quarter of 2026.
- Miles driven per state come from the Federal Highway Administration.
I checked the model against AAA’s own figures. Given AAA’s assumptions, the calculator’s yearly total comes within 1.0% of AAA’s $12,863.
The calculator leaves out costs that vary too much from one person to the next: dealer documentation fees, accidents and deductibles, tickets, car washes and accessories. It assumes full-coverage insurance for an adult driver with a clean record. If you’re under 25 or have a claim on your record, enter your real insurance quote.
If you drive only a few thousand miles a year, check whether owning a car makes sense at all. Our Uber vs owning a car calculator compares your yearly cost of owning with what the same trips would cost with Uber or Lyft.
How to calculate the cost of owning a car
- Find what the car will lose in value. Take the price you pay and subtract what the car will be worth when you sell. Divide by the years you keep it.
- Work out fuel. Divide the miles you drive in a year by the car’s combined MPG and multiply by your gas price. For an electric car, multiply miles by kWh per 100 miles, divide by 100 and multiply by your electricity rate.
- Add insurance. Use a real quote for the car, or your state’s full-coverage average.
- Add maintenance, repairs and tires. About 10 cents a mile for an average car in its first five years, plus a set of tires every 50,000 miles. Older cars cost more.
- Add loan interest and taxes. Add the interest you’ll pay each year, the sales tax spread over the years you keep the car, your yearly registration and any property tax. Add everything up and divide by 12 for a monthly cost.
FAQ
How much does it cost to own a car per year?
AAA puts the average cost of owning a new car at $12,863 a year in 2026, for a car driven 15,000 miles a year and kept five years. A small sedan averages $9,259 a year and a half-ton pickup $16,449. Your cost depends on the car, your state and how much you drive.
How much does it cost to own a car per month?
The 2026 AAA average is $1,072 a month for a new car. That includes the value the car loses, which you don’t pay monthly. The money you actually pay each month for fuel, insurance, maintenance, loan interest and fees is about $703.
How much does it cost to own a car per mile?
About 86 cents a mile for an average new car driven 15,000 miles a year, according to AAA’s 2026 figures. Driving fewer miles raises the cost per mile, because depreciation and insurance stay about the same no matter how much you drive.
What is the biggest cost of owning a car?
Depreciation. The average new car loses $4,422 in value each year over its first five years, about a third of the total cost. Insurance is usually second.
How much does car maintenance cost per year?
About $1,760 a year for maintenance, repairs and tires on a new car driven 15,000 miles, based on AAA’s 11.73 cents a mile. A car’s first three years cost much less because the warranty covers most repairs. A car over eight years old usually costs more.
Which car brands are cheapest to maintain?
Honda, Toyota, Mazda and Hyundai have the lowest average repair costs in RepairPal’s data, all under $470 a year. The all-brand average is $652. German luxury brands such as BMW and Audi average close to $1,000 a year.
Is an electric car cheaper to own than a gas car?
Not always. In AAA’s 2026 study the electric version cost more to own than the gas version in three of four classes, because EVs lose value faster. An EV comes out ahead when you charge at home on cheap electricity, drive a lot and keep the car longer than five years.
Is a hybrid cheaper to own?
Yes, in most cases. Hybrids were the cheapest to own in all four classes AAA compared in 2026. They use less fuel than gas cars and lose less value than both gas and electric cars.
How much does a car depreciate per year?
About 20% in the first year and then roughly 10% to 12% a year after that. The average car loses 41.8% of its value in five years. Pickups and hybrids lose the least. Electric cars and large luxury SUVs lose the most.
Is it cheaper to own a new or used car?
A used car is usually cheaper to own because the first owner already took the biggest drop in value. A three-to-five-year-old car loses less value each year, costs less to insure and tax and is still young enough that repairs stay reasonable.
How much is car insurance per year?
AAA uses $2,098 a year for full coverage on a new car in 2026, or about $175 a month. Your state makes a big difference. Drivers in Nevada pay about 1.6 times the national average for full coverage and drivers in Maine pay about 0.6 times.
How much are car registration and taxes per year?
AAA puts license, registration and taxes at $802 a year averaged over five years, which includes the sales tax you pay when you buy. Registration alone ranges from under $50 a year in some states to several hundred dollars in states that charge by the car’s value. Virginia, Connecticut, Mississippi and a few other states also charge a yearly property tax on cars.
What is the 5-year cost to own a car?
For the average new car, about $64,300 over five years at 15,000 miles a year, using AAA’s 2026 figure of $12,863 a year. To get the five-year cost for a specific car, pick it in the calculator above and set the years you keep it to 5.
How much does it cost to own a car per day?
About $35 a day for the average new car, based on AAA’s 2026 figure of $12,863 a year. The calculator shows the daily cost for your own car under the yearly total.
Sources & References
- AAA Your Driving Costs 2026 brochure: https://newsroom.aaa.com/wp-content/uploads/2026/09/8-YDC-Brochure_2026-1.pdf
- EPA and DOE fuel economy data (fueleconomy.gov): https://www.fueleconomy.gov/feg/ws/
- U.S. Energy Information Administration, gasoline and electricity prices: https://www.eia.gov/opendata/
- Federal Highway Administration, Highway Statistics 2024: https://www.fhwa.dot.gov/policyinformation/statistics/2024/
- iSeeCars, cars that hold their value study 2026: https://www.iseecars.com/cars-that-hold-their-value-study
- CarEdge, depreciation and maintenance by brand: https://caredge.com/depreciation
- RepairPal, reliability and repair cost by brand: https://repairpal.com/reliability
- Argonne National Laboratory for DOE, vehicle cost of ownership (maintenance per mile): https://www.energy.gov/sites/default/files/2021-07/van038_Gohlke_2021_o_5-27_455pm_LR_ML.pdf
- ValuePenguin, car insurance by state: https://www.valuepenguin.com/car-insurance-by-state
- Experian, average car loan interest rates by credit score: https://www.experian.com/blogs/ask-experian/average-car-loan-interest-rates-by-credit-score/
- Kelley Blue Book and Cox Automotive, average transaction prices: https://www.coxautoinc.com/insights/
- State DMV and revenue department fee schedules (51 jurisdictions, linked in the calculator)

James Kowalski
More from James KowalskiHow we reviewed this article
This article was researched against manufacturer records and editorially reviewed before publishing. We accept no payment for coverage. Some guides contain affiliate links; see our affiliate disclosure.